Commercial scale evaluation of real-time line monitoring

-
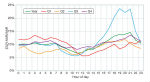
Figure 3. Yearly and quarterly average increased capacity delivered by... -

Figure 1. Location of the trial site. SGDP project map showing test lines -
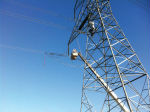
Installation of load cells on a lattice tower -
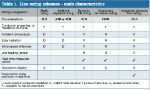
Table: Line rating schemes - main characteristics -
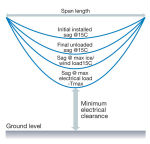
Figure 2. Causes of line sag -
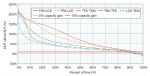
Figure 5. Capacity gains with dynamic line rating (DLR). -
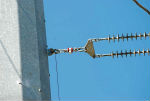
Installation of load cells on a lattice tower